Single cell analysis and sequencing
Needle Genomics, November 2020
With Brian Fox
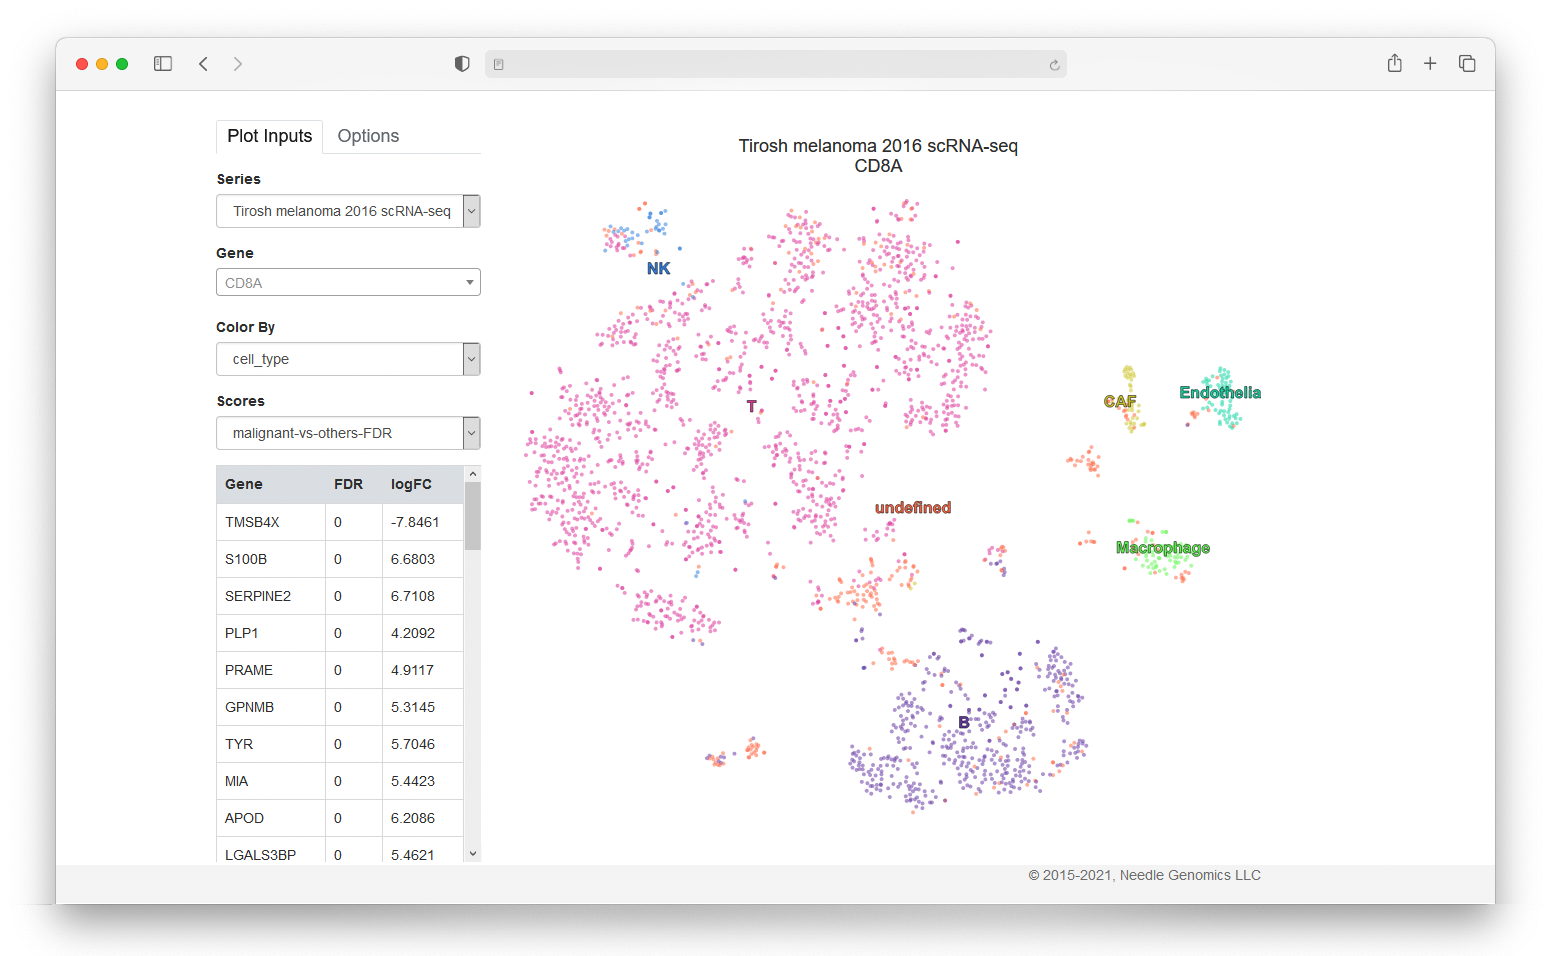
Visualizing scientific data is always a challenge because of the many variables and dimensions involved, but making it available in an easy-to-explore way should be a priority for scientists. One especially difficult dataset to represent graphically is gene expression data due to the huge quantity of information available for each cell. In this project, I developed a gene expression web application that visualizes single cell RNA-seq data using pre-calculated t-SNE coordinates for each cell. This tool allows experts to navigate through the overwhelming Gen Expression Omnibus dataset and focus on the most relevant genes and their properties.