LA County's COVID-19 Watch
LA County Department of Public Health, October 2020
With Anjali Tripathi
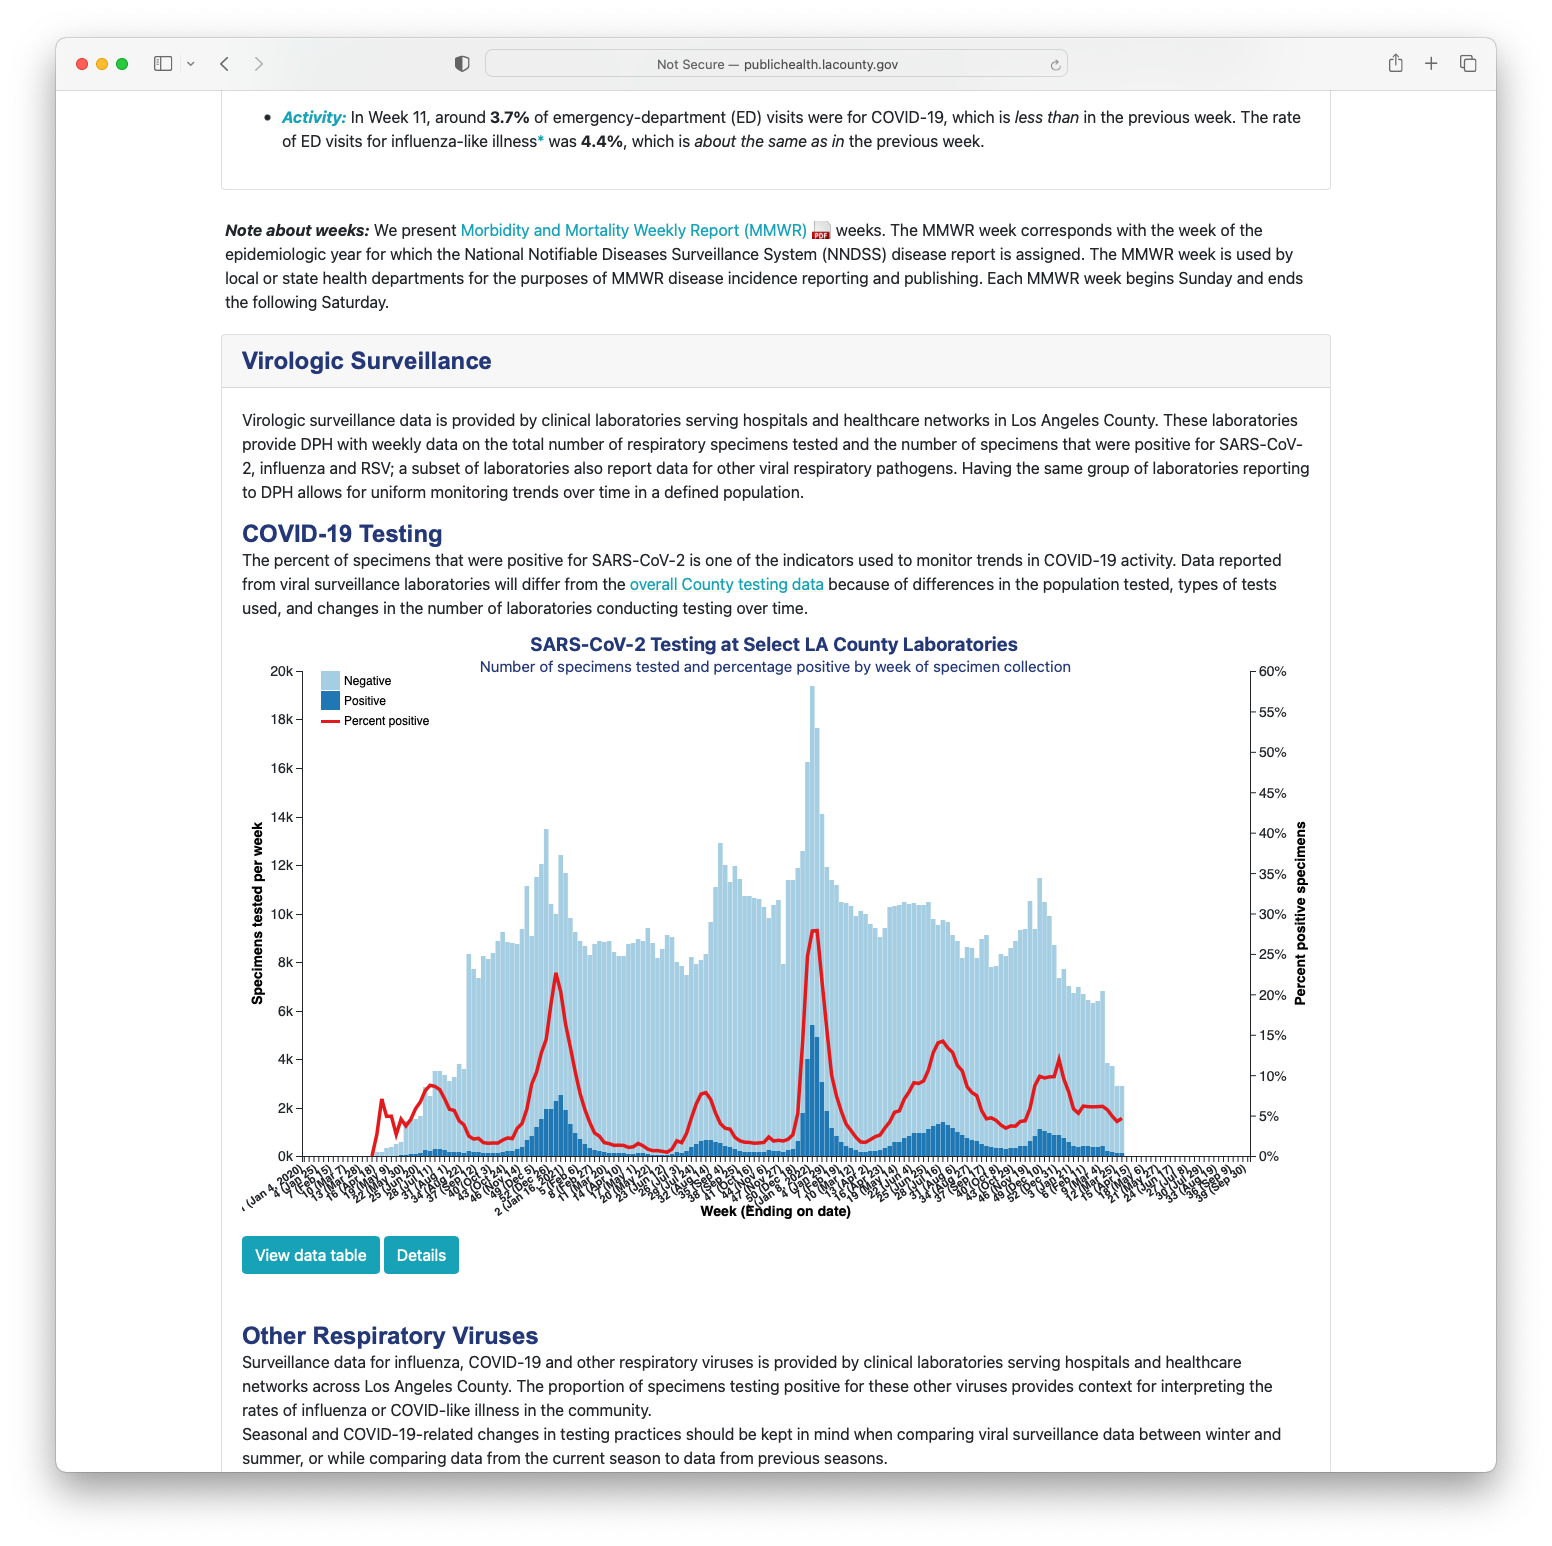
As the COVID-19 pandemic developed, more and more data became available to inform researchers, the media, and the general population. In order to inform their citizens of the current state of the pandemic, the County of Los Angeles Health Department published in their website a series of statistics regarding testing, symptoms, and deaths. Some of these graphics were generated as an image and needed to be updated manually every day, wasting time and resources. In order to optimize this process, I implemented a d3 plot that self-updates once the dataset is updated and adds interactivity to give more details to the user.