The COVID-19 toll in Chile
Personal project, June 2020
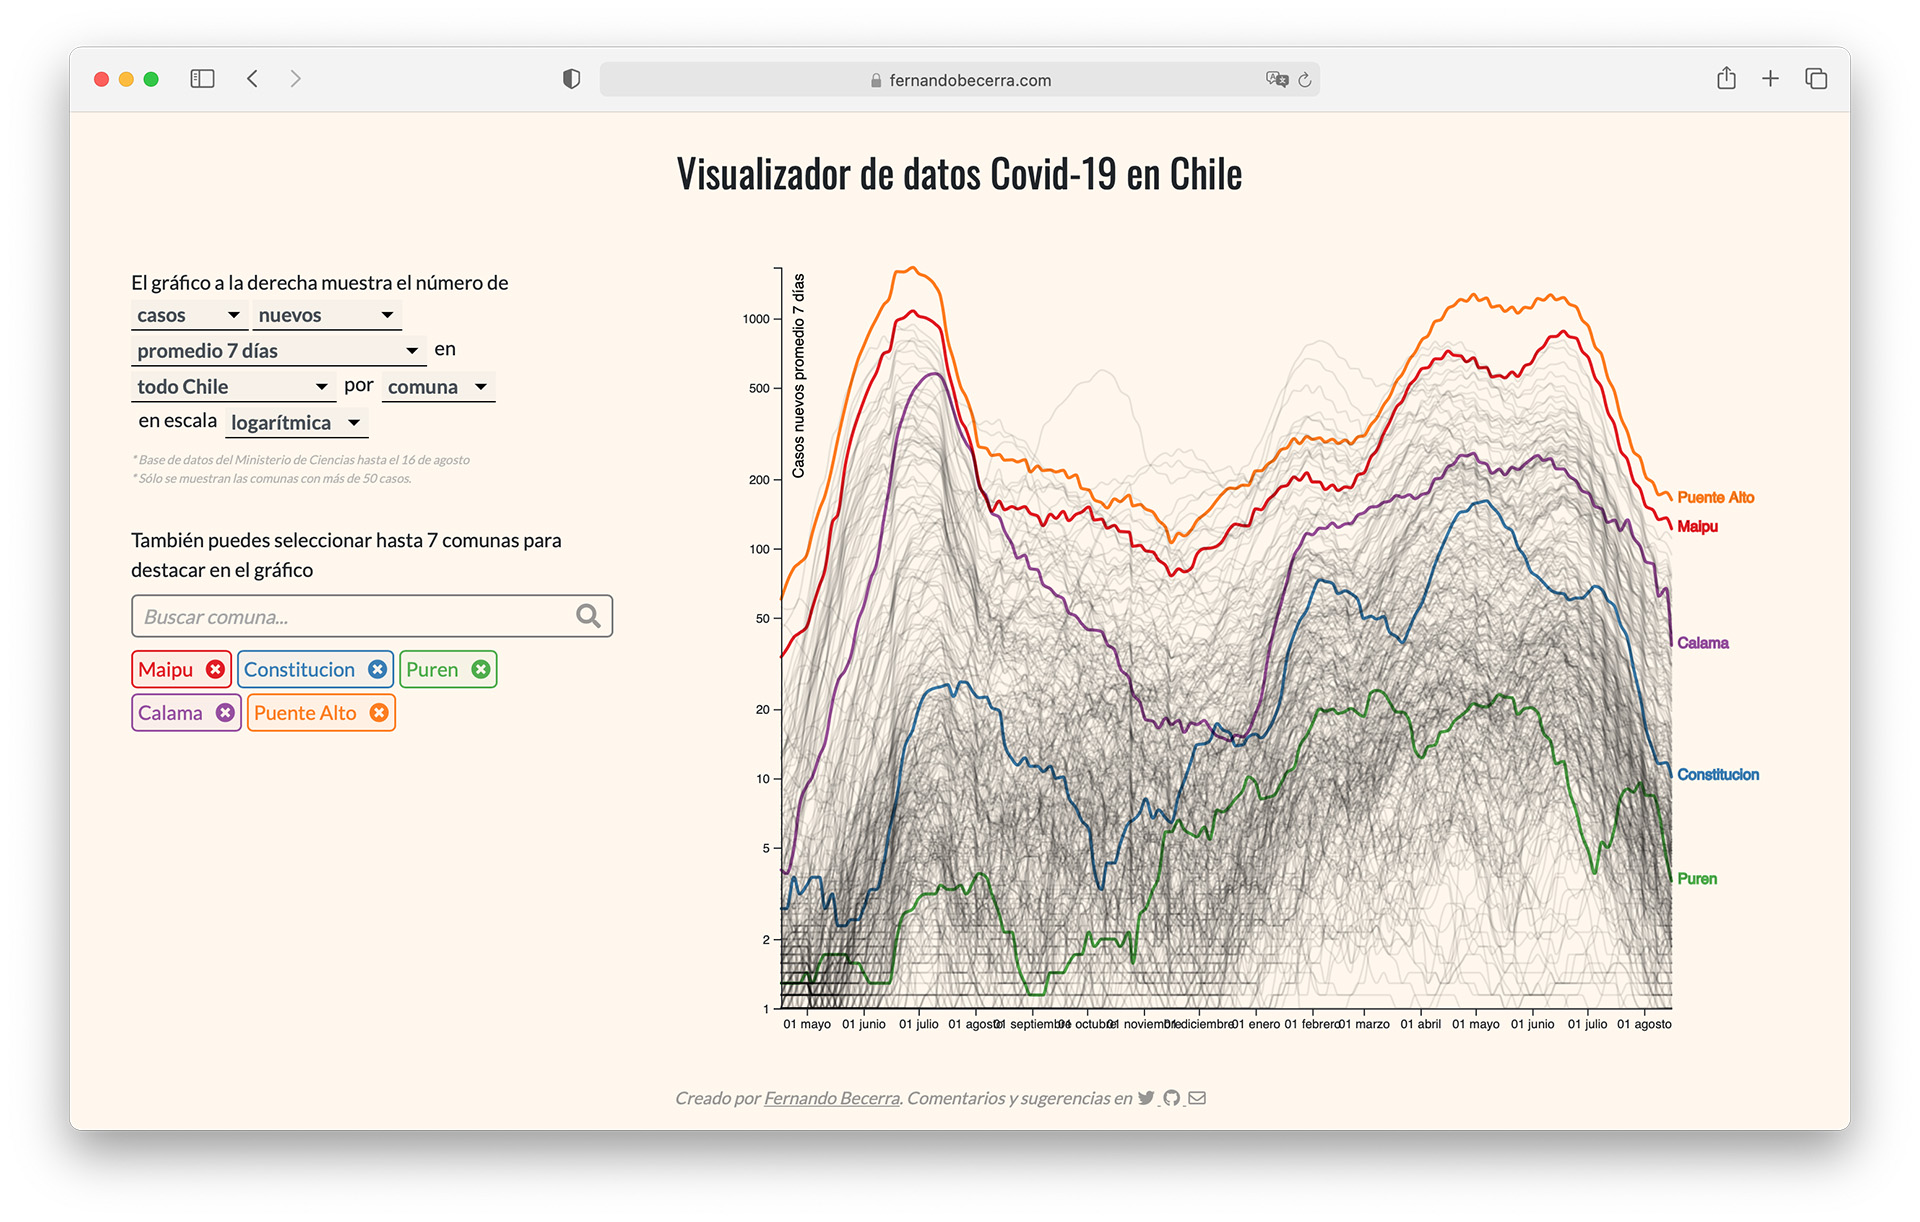
As COVID-19 cases began to steeply increase, graphs became an important way of communicating the impact that the pandemic was having globally. Media outlets, non-profits, government agencies, and other institutions started collecting the number of cases and deaths in different regions of the world. Many interactive visualizations became very popular overnight as a way to keep track of all that data without it becoming too overwhelming. That motivated me to create one of such visualizations for COVID-19 statistics in Chile, which would focus on making the data at the region and commune levels available for everyone to explore.